Bari Weather: Month By Month Temperatures And Sea Warmth
Bari, the capital of Puglia on Italy's Adriatic coast, has hot dry summers and mild wetter winters. Here are the typical monthly temperatures, rainfall and sea temperatures, from modelled climate data, and what they mean for a trip.
Short answer
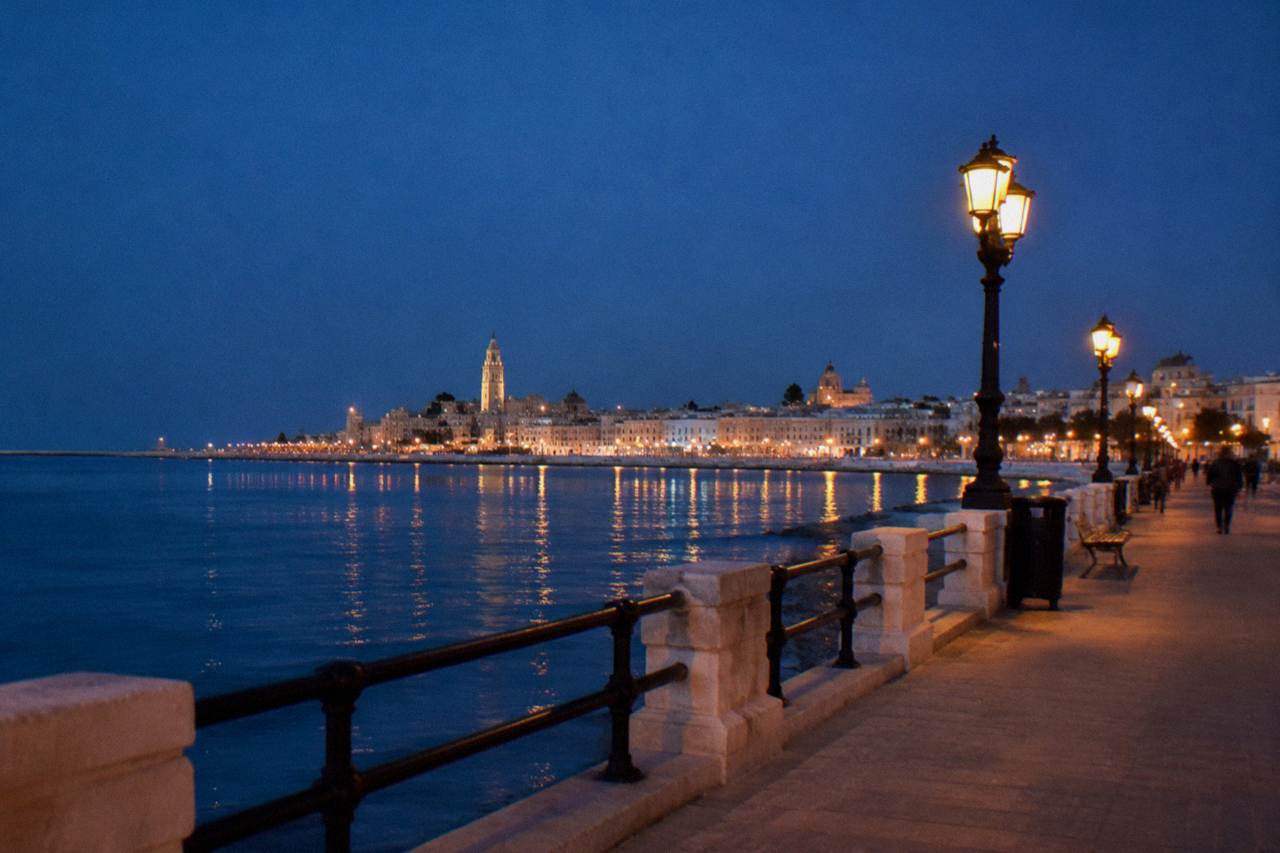
Bari is warm to hot from May to October, with July and August averaging daily highs of 28.6 C and 29.1 C, and mild in winter, with January and February highs of about 12 C. Rainfall totals about 587 mm a year, concentrated from October to January, and the sea reaches about 27 C in July and August.
Bari sits on the Adriatic Sea in Puglia, southern Italy, and its climate is the classic Mediterranean pattern: a long warm season, a short but real rainy stretch from autumn into winter, and almost no rain at all in the height of summer. All the figures on this page are typical values from modelled ERA5 data, 1991 to 2020, computed for the city itself, so they describe what a month usually looks like rather than any single year. Use them to pick dates, pack, and decide how much of the trip belongs to the Bari seafront and how much indoors.
What Are Typical Bari Temperatures Month By Month?
Bari's mean daily maximum climbs from 12.1 C in January to 29.1 C in August, with mean daily minimums between 7.2 C in February and 22.4 C in August, according to typical values from modelled ERA5 data, 1991 to 2020. May to September all average daily highs above 21 C, while December, January and February all stay in the 12 to 13 C range for daytime highs.
Those are averages, so a given day swings either side of them. The table below gives the full monthly picture: the mean daily maximum, the mean daily minimum and the mean temperature for each month of the year.
| Month | Mean daily high C | Mean daily low C | Mean C |
|---|---|---|---|
| January | 12.1 | 7.3 | 9.6 |
| February | 12.5 | 7.2 | 9.8 |
| March | 14.7 | 8.8 | 11.7 |
| April | 17.5 | 11.2 | 14.4 |
| May | 21.6 | 15.3 | 18.6 |
| June | 25.9 | 19.5 | 22.9 |
| July | 28.6 | 22.0 | 25.5 |
| August | 29.1 | 22.4 | 25.9 |
| September | 25.1 | 19.1 | 22.1 |
| October | 21.1 | 15.6 | 18.2 |
| November | 16.9 | 12.0 | 14.4 |
| December | 13.2 | 8.7 | 10.9 |
Two readings matter more than the averages for planning. First, summer nights: July and August lows of 22.0 and 22.4 C mean evenings stay warm right through, which is why the paseggio along the Lungomare Nazario Sauro stays busy late. Second, winter days: with January and February highs of about 12 C, a winter visit is jacket weather, not beach weather, but comfortable for walking Bari Vecchia and the museums. The seasonal detail is in the winter in Bari guide.
How Much Rain Does Bari Get And When?
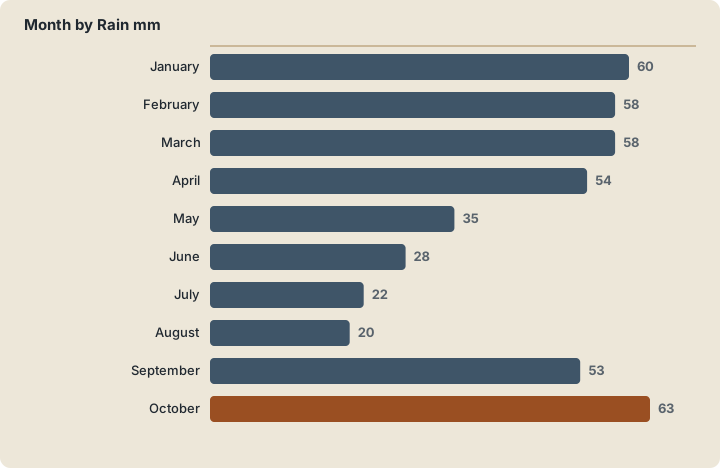
Bari receives about 587 mm of rain a year, and the distribution is strongly seasonal: November averages 73 mm and December and October 63 mm each, while August averages just 20 mm and July 22 mm, per typical values from modelled ERA5 data, 1991 to 2020. Rain days follow the same shape, from about 4 a month in July and August to 9.5 in January.
What that means in practice: a summer trip can expect long dry stretches, with roughly four days a month reaching 1 mm of rain or more, while an October or November visit should plan for a rainy day or two each week. The rain, when it comes, tends to arrive in concentrated autumn and winter systems rather than daily drizzle.
| Month | Rain mm | Rain days (1 mm or more) |
|---|---|---|
| January | 60 | 9.5 |
| February | 58 | 9.4 |
| March | 58 | 9.4 |
| April | 54 | 9.0 |
| May | 35 | 6.9 |
| June | 28 | 4.8 |
| July | 22 | 4.1 |
| August | 20 | 4.3 |
| September | 53 | 7.6 |
| October | 63 | 7.9 |
| November | 73 | 8.9 |
| December | 63 | 9.6 |
September is the swing month. Its rainfall figure of 53 mm sits close to April's, but its temperatures still read like summer, with a mean daily high of 25.1 C and sea warmth carried over from August. For a trip that balances warmth against crowds and rain, late September and May are the two shoulder windows the numbers point to, a comparison developed further in the best time to visit Bari guide.
How Warm Is The Sea In Bari?
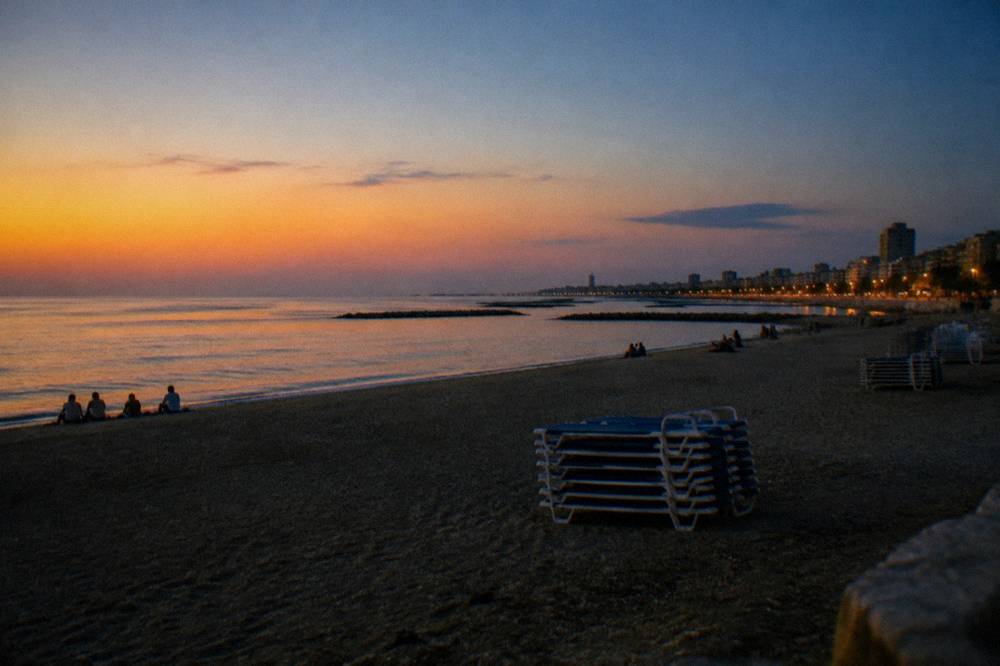
The sea off Bari reaches about 27 C in July and August, holds about 22 C in October and drops to about 14 C in February, based on modelled 2023 to 2025 means. That makes midsummer comfortably warm for swimming, October plausible for a short dip, and February distinctly cold, with the warming curve between February and July running steadily rather than in a jump.
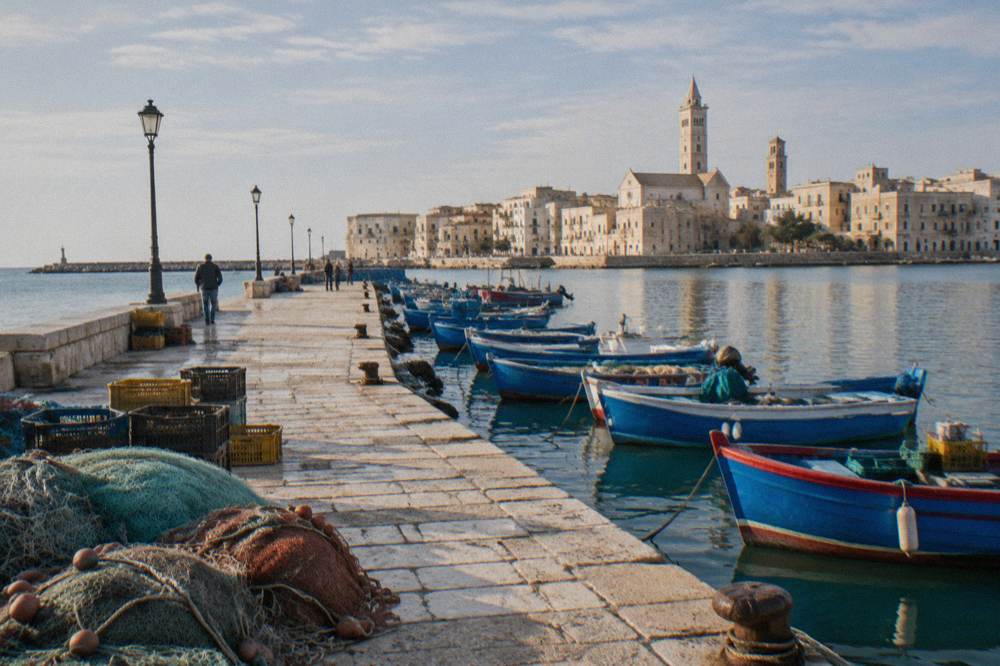
Only those three data points are modelled and released, so the honest advice is to treat late June and early July as approaching the summer peak and late April and May as cool. Bari's own city beaches, Pane e Pomodoro about 2.1 km from Piazza Mercantile, Torre Quetta about 3.9 km and San Girolamo about 4.3 km north-west, are where this matters inside the city; facilities and any lido charges vary by season and should be confirmed locally, and Bari itself holds no Blue Flag in 2026, while Polignano a Mare and Monopoli, both reachable as day trips, do. The Bari beaches guide covers the practical side.
Swimming aside, sea state matters for boat trips. The Bari coastal cruise with aperitivo runs from the city's own waterfront and is a fair-weather product, so in the wetter months check the operator's live listing for whether sailings run. Check availability close to your date if you are travelling outside June to September.
Which Month Has The Best Weather In Bari?
By the numbers, July and August are the warmest months, with mean daily highs of 28.6 C and 29.1 C and only about 4 rain days each, while May and September trade a few degrees of warmth, highs of 21.6 C and 25.1 C, for thinner crowds and rain figures of 35 and 53 mm. There is no single best month: it depends on whether heat or calm ranks higher for you.
The comparison the climate table supports, and the one the best month question examines in full, looks like this:
| Window | Mean daily high | Rain mm | What the numbers suggest |
|---|---|---|---|
| May | 21.6 C | 35 | Warm days, cool evenings, low rain |
| June | 25.9 C | 28 | Near-summer heat with half spring's rain days |
| July | 28.6 C | 22 | Peak heat, about 4 rain days |
| August | 29.1 C | 20 | The highest mean high of the year |
| September | 25.1 C | 53 | Summer warmth with returning rain |
| October | 21.1 C | 63 | Mild, sea still about 22 C |
One planning nuance the figures surface: early May sits inside the Festa di San Nicola window, which runs 7 to 9 May each year by tradition. The weather is usually settled by then, and the festival programme, with its historic procession and sea events, makes early May a month where culture and climate overlap. The details are in the San Nicola festival guide.
Is Bari Too Hot In Summer?
July and August mean daily highs of 28.6 C and 29.1 C are hot but not extreme by southern Italian standards, and nights that stay at 22 C and above mean the heat does not fully break after dark. Compared with inland Puglia towns, the coastal position keeps Bari's figures a little lower and its evenings more usable, though the midday hours are still full summer.
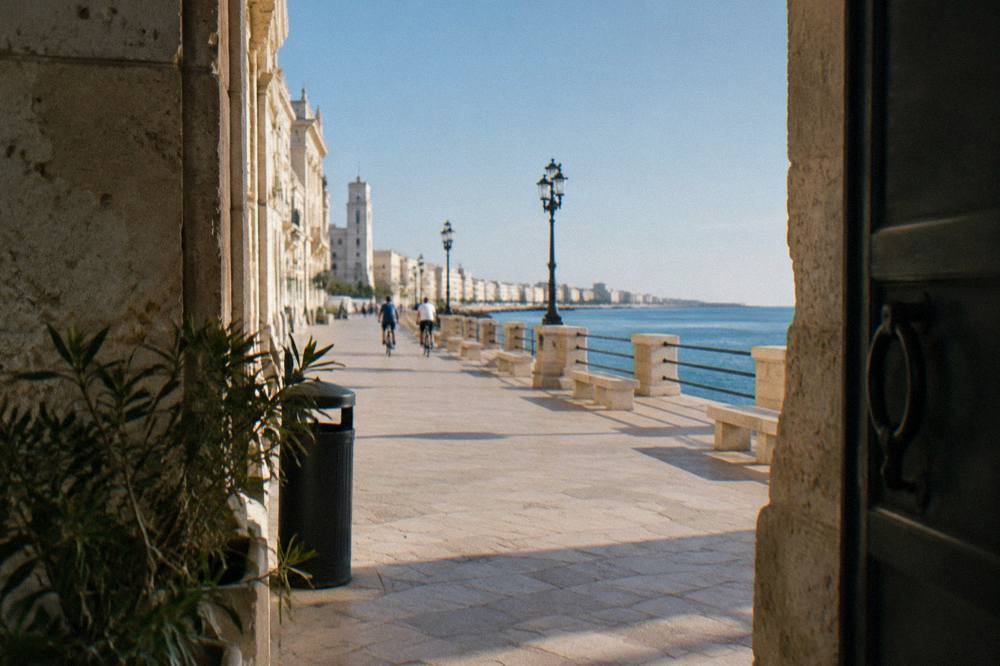
The practical response is to shape the day around the heat rather than fight it. Mornings belong to Bari Vecchia and the things to do in Bari that involve shade and stone, midday to a long lunch or a beach at Pane e Pomodoro, and evenings to the Lungomare, where the seafront promenade and the Fortino sant'Antonio end of the walk give the best of the late light. A guided activity that moves you along helps too: .
What Is Bari Weather Like In Winter?
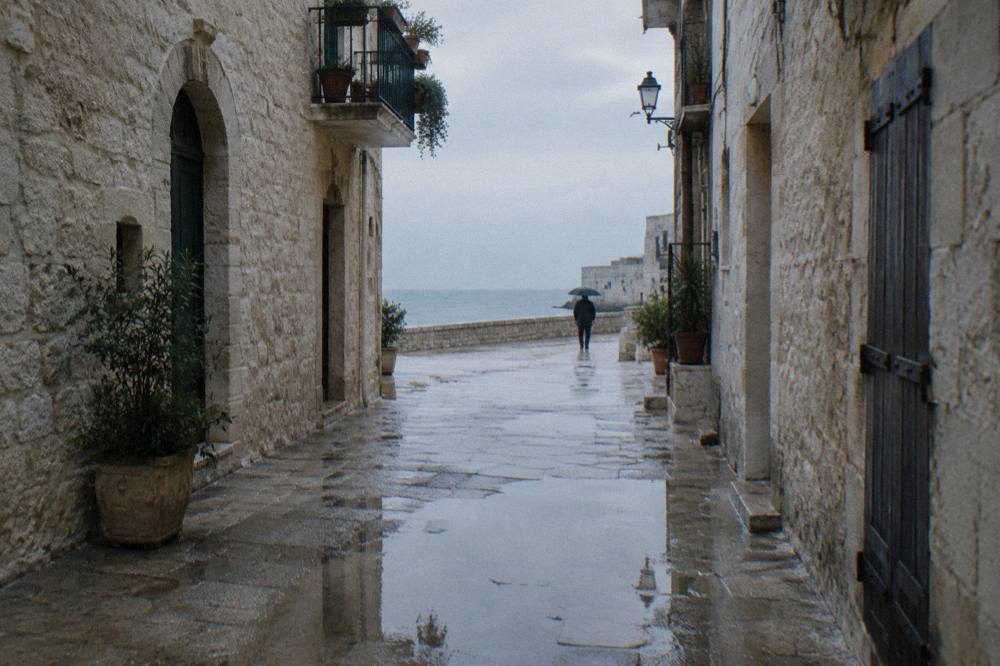
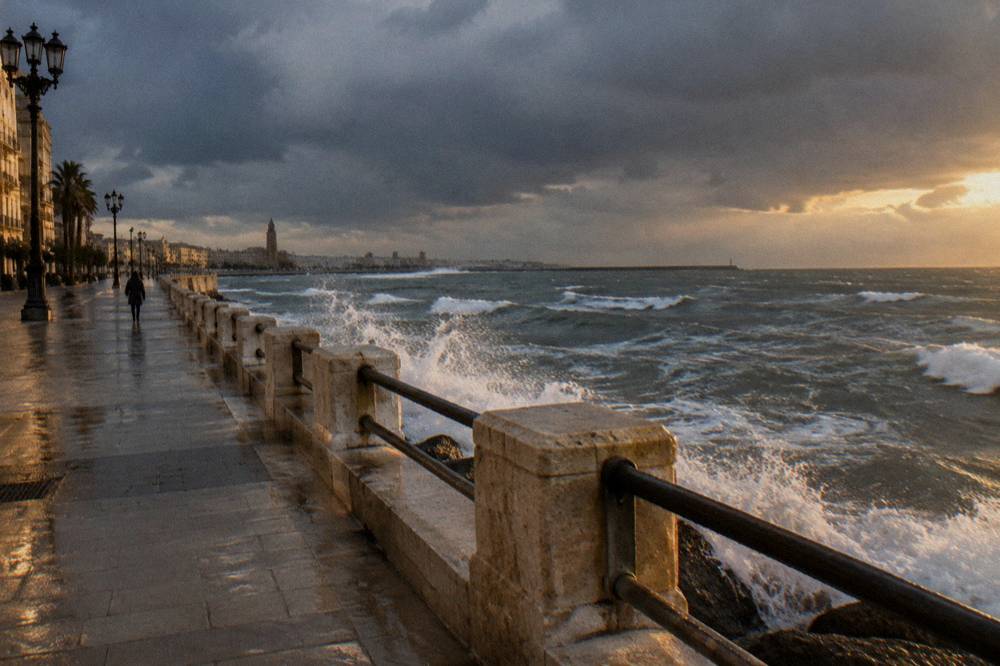
Winter in Bari is mild rather than cold, with mean daily highs of 12.1 C in January, 12.5 C in February and 13.2 C in December, and lows that stay above freezing in every month, from 7.2 C in February to 8.7 C in December. Rain is at its annual peak, with 60 to 73 mm a month from October to January and 8.9 to 9.6 rain days.
That profile puts Bari in the "walkable all year" category. A December or January day with sun and 12 C is normal, and the museums, the Castello Normanno-Svevo, which is open Tuesday to Sunday 09:00 to 19:00, and the food halls of the old town all work in any weather. The trade-off is the rain-day count: plan each winter week with two or three indoor options in reserve. The seasonal detail, including what stays open and how the city feels, is in the winter guide.
For a rainy afternoon, a cooking class keeps the day full whatever the sky does: .
How Should You Pack For Bari In Each Season?
Pack for summer heat from June to September, with July and August highs of 28.6 C and 29.1 C and nights above 22 C; for layers in April, May and October, when highs run 17.5 to 21.6 C and rain returns; and for mild wet weather from November to March, when highs sit near 12 to 17 C and rain days top 8.5 a month. A compact umbrella earns its place from October to April.
The seasonal summary table turns the monthly figures into wardrobe and activity decisions:
| Season | Months | Mean daily high | Rain days per month | Packing read |
|---|---|---|---|---|
| High summer | June to August | 25.9 to 29.1 C | 20 to 28 | Light clothing, sun protection, evening wear that works at 22 C |
| Early autumn | September to October | 21.1 to 25.1 C | 53 to 63 | Summer clothes plus a layer and a light rain option |
| Late autumn | November | 16.9 C | 8.9 | Jacket, umbrella, indoor plans in reserve |
| Winter | December to February | 12.1 to 13.2 C | 58 to 63 | Warm jacket, waterproof, layers |
| Spring | March to May | 14.7 to 21.6 C | 35 to 58 | Layers, light rain option, swimwear by late May |
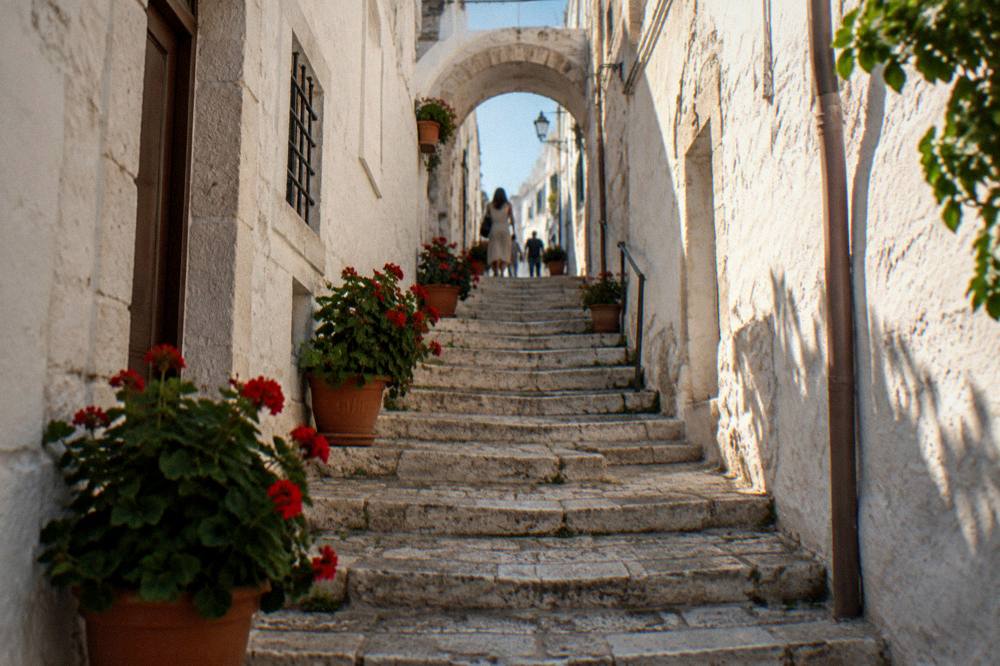
Footwear deserves one line of its own: Bari Vecchia is stone underfoot, the Lungomare is a long walk, and in July and August that stone holds the day's heat well into the evening. Solid shoes beat sandals for old-town days at any time of year.
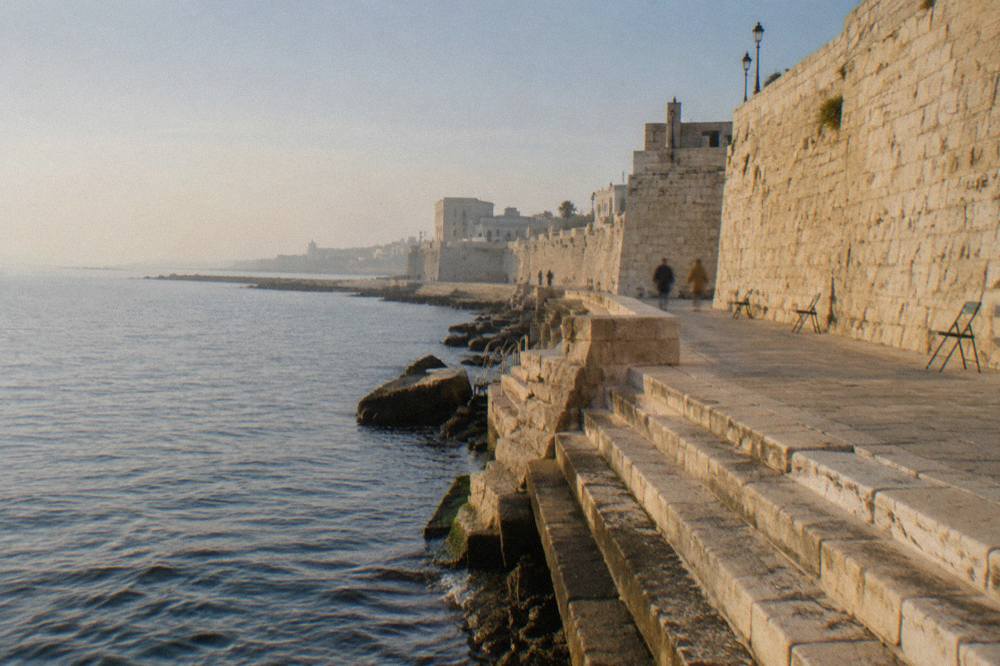
Does Bari Weather Affect Day Trips And Ferries?
Day trips inland run hotter than the coast in summer and the numbers matter most for Castel del Monte and the Valle d'Itria towns, while autumn rain and the reported interruption of the Jadrolinija Dubrovnik to Bari ferry line in 2026 are the two weather-adjacent items that can move a plan. In all cases, check the operator's timetable before you travel.
The inland points on a Puglia itinerary sit at elevation or on exposed ridges: Castel del Monte is an open hilltop site where summer midday sun is the constraint and winter wind can be, and the same applies to Alberobello and Locorotondo, where the walking is outdoors. Coastal day trips, Polignano a Mare and Monopoli, mirror Bari's own numbers. A boat or cave tour around Polignano, which departs from Polignano itself, not from Bari, is the trip most sensitive to sea conditions, and operators reroute or cancel when the Adriatic is rough, typically in the October to March months.
On ferries, the Bari to Durres route sails every day all year with a crossing of about 8 hours per the operator, and the Bari, Corfu, Igoumenitsa, Patras route is listed in the 2026 brochure. The Dubrovnik to Bari line is seasonal and was reported interrupted for technical reasons in autumn 2026, so confirm that the line is operating before planning around it. Rain and wind shift sailings in late autumn more than in summer, and the operators post changes first.
The Castel del Monte day tour is the inland pick where the calendar matters most: .
Common Questions About Bari Weather
What is the warmest month in Bari?
August, with a mean daily high of 29.1 C and a mean temperature of 25.9 C, per typical values from modelled ERA5 data, 1991 to 2020. July sits just behind at 28.6 C.
What is the rainiest month in Bari?
November, averaging 73 mm of rain across about 8.9 rain days, from the same modelled data. December and October follow at 63 mm each.
When can you swim in Bari?
The sea reaches about 27 C in July and August and about 22 C in October, based on modelled 2023 to 2025 means, so July to September is the comfortable window and October is a short-dip month.
Does it ever get cold in Bari?
Winter is mild: January and February highs average about 12 C and February lows 7.2 C, and no month's mean daily minimum falls to freezing. Pack a warm jacket, not Arctic gear.
Is Bari warm in winter?
Mild is the fair word. December to February mean daily highs run 12.1 to 13.2 C with 9.4 to 9.6 rain days a month, so sunny 12 C days are normal alongside wet ones.
Which months have the least rain in Bari?
July and August, averaging 22 mm and 20 mm respectively with about 4 rain days each, per typical values from modelled ERA5 data, 1991 to 2020. June follows at 28 mm.
The short version: Bari gives you a warm-weather city from May to October, a hot and reliably dry July and August, and a mild, damper winter that still handles sightseeing well. Match the month to what you want from the sea, book the boat and castle days into the calm part of your week, and the climate table does the rest.